Actuarial Intelligence for
Cyber Insurance.
Carriers using Thrivaca underwriting data have achieved loss ratios one-fourth the industry average over a five-year horizon. That’s not a projection — it’s a measured outcome.
ThrivacaInsure™ provides the actuarial-grade risk intelligence and proprietary data that underwriters, portfolio managers, and brokers need to price accurately, select profitably, and communicate clearly.

4X Better
Industry Loss Ratios

Within 7% of UHC
Actual Losses

35% of S&P 500 Analyzed

4,000+ Company Risk Profiles

580 Industries

60,000+ Incident Loss Database
.png?width=68&height=68&name=Scatter%20Plot%20(1).png)
r = .668
Breach Correlation
Cyber Underwriting Is Still Flying Blind.
THE DATA QUALITY PROBLEM
Most cyber underwriting still relies on application questionnaires, external scan scores, and professional opinion.
These inputs are subjective, inconsistent across submissions, and disconnected from the actuarial loss distributions that every other insurance line depends on.
The result: pricing that reflects what the underwriter believes, not what the data shows.
THE PORTFOLIO VISIBILITY PROBLEM
Carriers cannot see their aggregate portfolio exposure in actuarial terms.
Individual risk selection may be adequate, but portfolio-level concentration risk, industry correlation, and tail exposure remain opaque.
When a UnitedHealthcare-scale event occurs, carriers discover their exposure after the loss — not before.
Bound company risk posture changes go unmonitored between underwriting and renewal, and deteriorating risks trigger claims without early warning.
THE BROKER COMMUNICATION PROBLEM
Brokers cannot quantify client cyber exposure in the financial language carriers need to underwrite accurately and clients need to make coverage decisions.
The result: adversarial placement conversations based on incomplete information, leading to coverage gaps, mispriced policies, and client dissatisfaction after claims.
Brokers are stuck in transactional placement when they should be delivering strategic risk partnership.
The cyber insurance market is growing rapidly, but underwriting discipline has not kept pace.
The carriers and brokers who solve the data quality problem first will capture disproportionate market share with superior loss ratios and deeper client relationships.
Why does this ArxNimbus Insurance solution matter?
Without measurable exposure, pricing, portfolio strategy, and broker recommendations are less consistent
and harder to defend.
The Full Cyber Underwriting Lifecycle. Actuarial-Grade Intelligence at Every Stage.
ThrivacaInsure applies the same patented actuarial AI engine used by enterprise clients —
configured specifically for insurance use cases. The output is not a score on a scale.
It is comprehensive, actuarial-grade intelligence that expresses cyber exposure in the financial terms underwriters and actuaries already use.
|
INSURABILITY ASSESSMENT & |
The quantitative financial foundation underwriters need to evaluate prospective risks:
These metrics move insurability decisions from subjective scoring to defensible, dollarized exposure analysis. |
|
PREMIUM SETTING & |
The result: premiums anchored to actuarial exposure, not professional opinion. |
|
PORTFOLIO MANAGEMENT & BOUND COMPANY SERVICES: |
Supports informed decisions on renewals, pricing adjustments, and coverage modifications throughout the policy period, not just at inception and expiry. |
|
INCIDENT RESPONSE & RECOVERY ANALYTICS: |
The same actuarial engine that priced the risk now quantifies the loss. |
|
VALIDATED PREDICTIVE POWER: |
|
Powered by the same patented actuarial AI engine built on NIST-designed methodology —
the only NIST-approved process in the cyber risk quantification sector. Patent granted.
From Transactional Cyber Insurance Placement
to Strategic Risk Partnership.
ThrivacaInsure helps brokers quantify client cyber exposure in the financial language that carriers use, boards oversee, and CFOs allocate capital.
The result: placement conversations grounded in data, not negotiation.
Explore the workflow below ↓
-
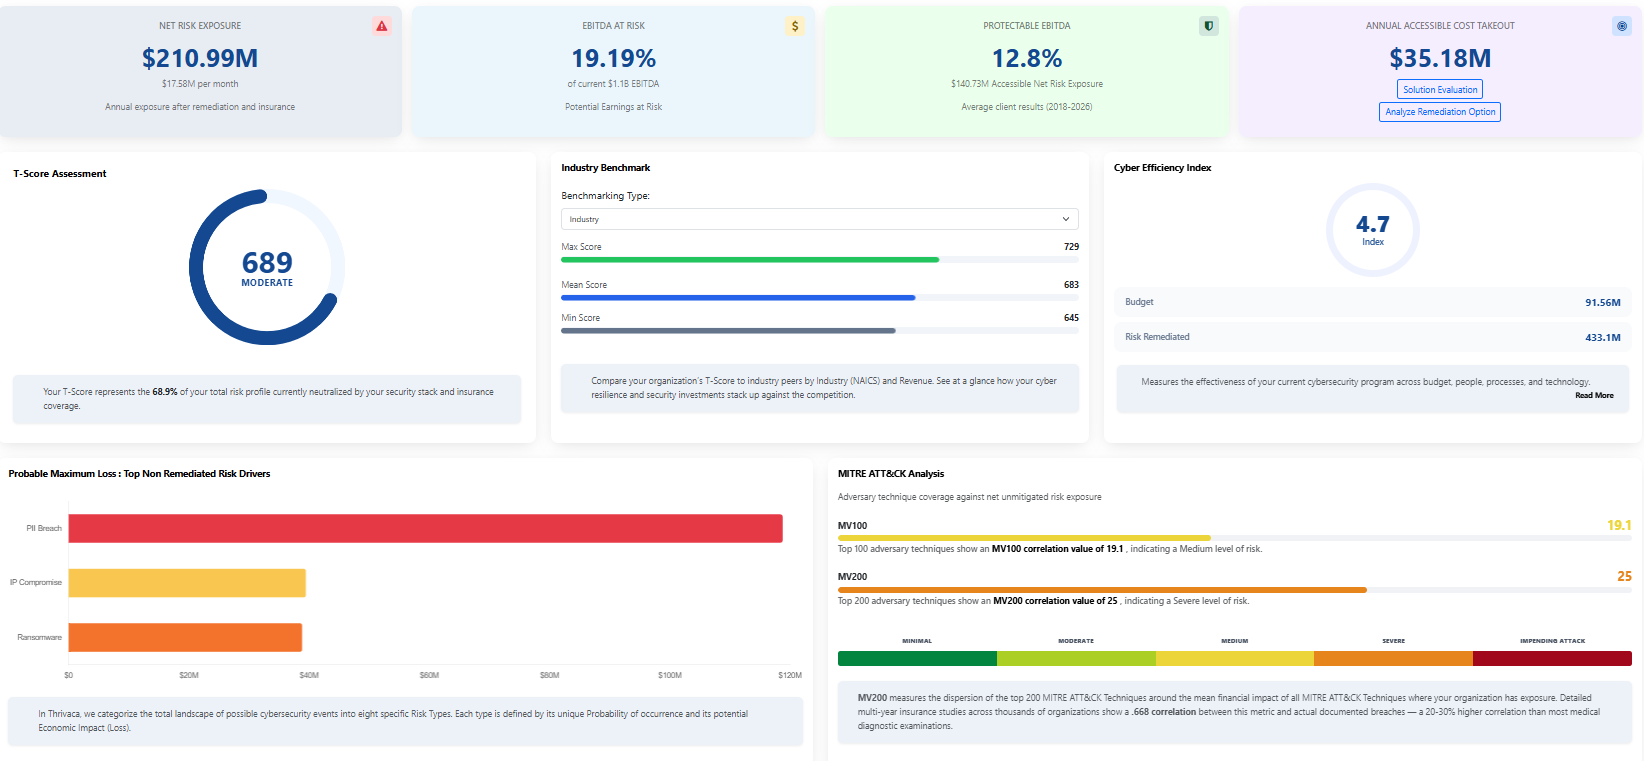
Residual cyber risk quantification defining financial exposure remaining after controls and coverage, expressed as EBITDA impact rather than abstract risk scores.
-
The proprietary Risk-Per-Enterprise-Value (RPEV) Index linking cyber risk directly to enterprise value and shareholder impact.
-
Real-time industry benchmarking across 4,000+ companies in 580 segments.
-
Advanced trend analysis drawing from 32 authoritative data sources.
-
Scenario-based cyber strategy optimization through digital twin modeling.
These financial-first analytics enable brokers to frame client conversations around business outcomes — what risk means in dollars, not just severity ratings.
-
Actuarial Risk Profile for each client expressing cyber exposure in dollars — Total Digital Risk, Net Risk Exposure, and Probable Maximum Loss.
-
Insurance optimization analysis identifying the inflection point where remediation becomes less cost-effective than risk transfer.
-
Self-insurance vs. commercial insurance comparison grounded in actuarial data.
-
Present carriers with Risk Profiles that speak their language — transforming placement from adversarial negotiation to data-driven collaboration.
Recommend coverage levels based on quantified PML, Net Risk Exposure, and industry benchmarks rather than rules of thumb.
-
SBOM and AIBOM supply-chain risk analysis for clients with software and AI exposure.
-
IoT and Industrial Control System exposure assessment for critical infrastructure clients.
-
Integrated GRC solutions with risk registers.
-
Extensive compliance framework library spanning NIST 800-53, ISO 27001, GDPR, HIPAA, and emerging SEC/CISA requirements.
-
Each capability translates technical findings into the financial metrics that CFOs and boards require for decision-making.
-
Available as enhancement modules for broker teams advising clients with complex technology environments.
-
Quarterly updated Risk Profiles showing how client risk posture evolves over the policy period.
-
Demonstrate measurable risk improvement to carriers at renewal, supporting premium reduction conversations with data instead of narrative.
-
T-Score™ trend analysis provides objective evidence of cybersecurity program maturity.
-
Track whether client security investments are producing measurable ROI via the Cyber Efficiency Index — turning renewal from a pricing negotiation into an evidence-based review.
The net effect: brokers move from transactional placement to strategic risk partnership.
Clients achieve 1–3% EBITDA improvement through data-driven risk reduction.
Organizations typically uncover unquantified exposure exceeding 25% of EBITDA.
Proprietary Data Assets. Not Just Scored Outputs.
ThrivacaInsure provides direct access to the proprietary datasets that power the actuarial engine — enabling carriers to integrate ArxNimbus intelligence into their own models, pricing tools, and portfolio analytics, and enabling brokers to deliver quantified, financially grounded counsel their clients can take directly to the board.
Explore the workflow below ↓
-
60,000+ unique cyber incidents with actual dollarized loss data. Not projected or estimated losses — real outcomes mapped to incident type, industry, organization size, and attack technique.
-
Enables carriers to calibrate their own loss models against the deepest commercially available cyber incident dataset.
-
Supports evidence-based coverage recommendations for brokers.
-
4,000+ individual company Risk Profiles — the largest commercial cyber risk repository of its kind.
-
Covers all NASDAQ, NYSE, S&P 500, and Russell 2000 companies across 580+ industry segments at four-digit NAICS granularity.
-
Updated quarterly.
-
Each profile includes Total Digital Risk, Remediated Risk, Net Risk Exposure, T-Score™, Cyber Efficiency Index, NIST CSF analysis, and expected loss by MITRE ATT&CK technique.
- Provides the comparative intelligence underwriters need for risk selection and brokers need to position clients against peers.
-
Tracks the evolution of cyber risk by attack type, severity, and industry over time.
-
Drawn from 32 primary authoritative sources and validated against real-world outcomes.
-
Identifies emerging risk patterns before they appear in industry loss reports.
-
Enables carriers to adjust appetite and pricing proactively and brokers to advise clients on evolving threat landscapes with actuarial data rather than vendor marketing.
ArxNimbus provides analytics support to help underwriting teams and broker advisory teams interpret data, build custom queries, develop proprietary insights, and construct client presentations grounded in actuarial intelligence.
This is not self-service data access with no guidance — it is a partnership that helps insurance professionals extract maximum value from the data assets.
Snowflake Integration: Structured monthly data transfer into carrier analytics environments with full schema mapping
API Access: RESTful API for programmatic access to Risk Profile data and library metrics
Raw Data Access: Complete underlying data beyond portal visualizations available for carrier and broker modeling teams
Portal: Web-based dashboard for interactive Risk Profile exploration and benchmarking
These data assets — drawn from 32 primary authoritative sources and validated against real-world outcomes including the UnitedHealthcare breach forecast (within ~7% of actual losses) — give carriers the actuarial-grade raw material to sharpen pricing, refine segmentation, and build differentiated underwriting capabilities.
From Cyber Insurance Submission to Actuarial Risk Profile.
|
INSURABILITY ASSESSMENT & |
The quantitative financial foundation underwriters need to evaluate prospective risks:
These metrics move insurability decisions from subjective scoring to defensible, dollarized exposure analysis. |
|
PREMIUM SETTING & |
The result: premiums anchored to actuarial exposure, not professional opinion. |
|
PORTFOLIO MANAGEMENT & BOUND COMPANY SERVICES: |
Supports informed decisions on renewals, pricing adjustments, and coverage modifications throughout the policy period, not just at inception and expiry. |
|
INCIDENT RESPONSE & RECOVERY ANALYTICS: |
The same actuarial engine that priced the risk now quantifies the loss. |
|
VALIDATED PREDICTIVE POWER: |
|
Powered by the same patented actuarial AI engine built on NIST-designed methodology —
the only NIST-approved process in the cyber risk quantification sector. Patent granted.
Measured Cyber Insurance Outcomes. Not Projected Improvements.
Loss ratios one-fourth the industry average over a five-year horizon for carrier partners using Thrivaca underwriting data.
This is not a projected improvement — it is a measured outcome that allows cyber insurance policies to be issued with greater predictability and more effective premium pricing.
Policies underwritten using Thrivaca technology cover approximately 35% of S&P 500 companies.
Cross-correlation of r = .668 with actual breach incidents — significantly stronger than radiological exams predicting disease onset, academic tests predicting student performance, or most other statistical correlations society relies on daily.
UnitedHealthcare breach impact forecast within 7% of actual losses — one of the largest and most complex cyber losses in healthcare history.
Projection made using data available before the full scope of losses was known, demonstrating the engine’s ability to model complex, cascading financial exposures with actuarial precision.
60,000+ unique cyber incidents with actual dollarized loss data.
4,000+ individual company Risk Profiles across 580+ industry segments, updated quarterly.
32 primary authoritative data sources.
47,000+ threat-vulnerability pairings.
The deepest commercially available actuarial cyber risk dataset.
Healthcare sector sub-segment analysis demonstrated that certain healthcare verticals are materially better risks than the broad-brush sector classification suggests — enabling carrier partners to expand appetite in specific sub-segments with data-driven confidence rather than contracting the entire sector based on headlines.
Developed in coordination with US Strategic Command, MITRE Corporation, University of Chicago Economics, University of Illinois Actuarial Science, Arizona State University AI Lab, and Anthropic.
NIST-approved methodology — only organization in the industry group.
Patent granted.
What Changes for Your Organization.
UNDERWRITERS & ACTUARIES
Replace questionnaire-driven assessment with actuarial Risk Profiles expressing exposure in annualized expected loss values.
Price policies based on 47,000+ threat-vulnerability pairings and actuarial loss distributions — not professional opinion.
Benchmark each submission against 4,000+ companies across 580 industries.
Monitor bound company risk posture continuously with early-warning alerting.
Make risk selection decisions in hours with the same data quality that has produced loss ratios one-fourth the industry average over five years.
PORTFOLIO MANAGERS & CUOs
See aggregate portfolio exposure in actuarial terms — industry concentration, tail risk, and trend analysis updated quarterly.
Stress test the portfolio with digital twin scenario modeling before catastrophic events reveal hidden correlations.
Monitor bound company risk posture changes throughout the policy period, not just at renewal.
Identify which segments to expand and which to reduce based on measured risk quality, not market sentiment.
BROKERS & PLACEMENT TEAMS
Quantify client cyber exposure in the financial language carriers underwrite with.
Present actuarial Risk Profiles that transform placement from adversarial negotiation to data-driven collaboration.
Use the RPEV Index to link cyber risk to enterprise value for board-level conversations.
Recommend coverage levels based on quantified PML, Net Risk Exposure, and the remediation vs. risk transfer inflection point.
Demonstrate measurable client risk improvement at renewal with T-Score™ trend analysis. Move from transactional placement to strategic risk partnership.
INSURETECH & MGA PLATFORMS
Integrate actuarial-grade cyber risk data into your underwriting platform via Snowflake or RESTful API.
Access the largest commercial cyber risk profile library (4,000+ companies, 580 industries) and the deepest incident loss database (60,000+ incidents) as data feeds powering your own analytics.
Build differentiated insurance products on top of actuarial risk intelligence that competing data vendors cannot match. White-label Risk Profile capability for embedded insurance offerings.
Cyber Insurance Deployment Snapshot.
-
Delivery: SaaS platform with Snowflake integration and API access
-
Initial Risk Profile: Available within 5 business days per submission
-
Library Access: 4,000+ pre-built company Risk Profiles available immediately for portfolio analysis
-
Loss Database: 60,000+ unique cyber incidents with actual dollarized loss data
-
Benchmarking Updates: Quarterly refresh across all companies and industries
-
Data Integration: Snowflake monthly data transfer with full schema mapping, RESTful API, raw data access
-
Analytics Support: Dedicated team for custom queries, proprietary insights, and client presentation development
-
Scale: Enterprise-grade — validated to 600,000+ endpoints, 5,300+ applications per insured
-
Compliance: NIST 800-53, NIST CSF, MITRE ATT&CK, FFIEC, and sector-specific frameworks
- Pricing: Subscription-based, scaled to portfolio size and data integration requirements
Better Data. Better Loss Ratios. Measured.
Carriers using Thrivaca underwriting data have achieved loss ratios one-fourth the industry average.
Brokers using Thrivaca Risk Profiles transform placement conversations from adversarial to collaborative — and their clients uncover unquantified exposure exceeding 25% of EBITDA.
The actuarial intelligence is the same. The outcomes are proven.
The question is whether your portfolio has access to it.