Cybersecurity Exposure.
Quantified by AI.
Measured in EBITDA.
Your organization runs 50+ security tools. Each one speaks a different language. None of them can tell you what your EBITDA exposure actually is.
The Thrivaca AI Engine translates fragmented security data into actuarially validated financial metrics — so every dollar of exposure is measured against EBITDA impact, every remediation is prioritized by financial return, and every stakeholder works from one actuarially validated number.
The Cyber Exposure You Can't See Is The Exposure
Eating Your EBITDA.
Most organizations cannot quantify cyber exposure in financial terms—
leaving leaders unable to measure EBITDA risk or prioritize mitigation effectively.
THE FRAGMENTATION PROBLEM
50+ security tools generating conflicting data in incompatible formats.
No normalization. No unified view.
Your SIEM aggregates events but cannot normalize risk or quantify financial exposure.
THE COMMUNICATION GAP
A documented 12–30 percentage point gap between what CISOs report and what boards understand.
Heat maps and traffic-light scoring cannot answer the board’s real question: “How much EBITDA is at risk?”
Without that answer, fiduciary decisions are made on incomplete data.
THE MEASUREMENT FAILURE
Legacy CRQ approaches (FAIR, Monte Carlo, VaR) depend on professional opinion and subjective judgment.
They require clean data that doesn’t exist. They produce ranges, not actuarial metrics.
At enterprise scale, they break. Organizations consistently underestimate true EBITDA exposure by 89–400%.
These aren’t process problems. They are data problems at a scale that only AI can solve.
That’s why the ArxNimbus Thrivaca AI Engine exists —
and why it was built on actuarial science, not professional opinion.
One Actuarial AI Engine. Two Ways to Quantify Cyber Exposure.
The Thrivaca AI Engine performs dual translation — AI-driven machine-to-machine normalization of fragmented security data, and machine-to-human conversion into EBITDA-grade financial exposure metrics. The same patented actuarial AI engine built on NIST-designed methodology and trusted by insurers covering 35% of the S&P 500.
The output: current EBITDA at risk, projected EBITDA exposure after controls, and ROI for every remediation dollar.
Two products.
Same engine.
Different data intake modes.
Choose based on your needs:
Need a point-in-time exposure assessment? Start with CORE.
Need continuous visibility across your full security stack? Start with UNIFY.
Both use the same patented actuarial engine. Both deliver financial exposure in dollars.
Thrivaca
|
Thrivaca
|
|
Best for: |
|
|
How It Works: |
|
|
Data Sources: |
|
|
Key Outputs: |
|
|
Unique Capabilities: |
|
|
Delivery: |
|
|
Starting Investment: |
|
|
|
|
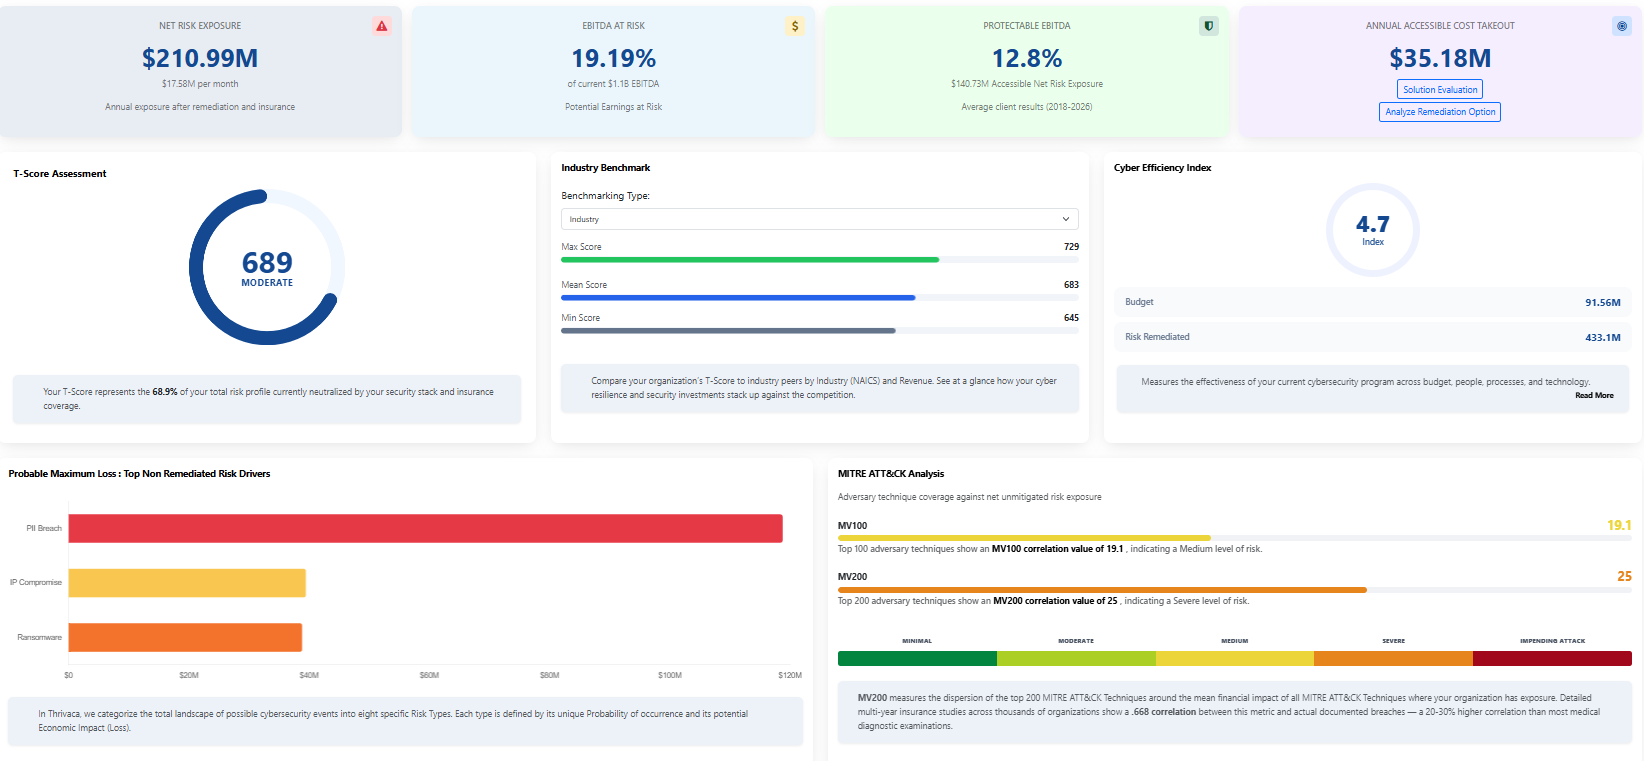
What Organizations Use Cyber Exposure Intelligence For.
Two defensible numbers:
-
current EBITDA at risk
-
projected exposure after controls
Replace heat maps with actuarial financial metrics aligned to NACD governance principles and SEC disclosure requirements.
-
AI-driven identification of the highest-impact areas for risk reduction based on EBITDA exposure, not technical severity.
-
The Cyber Efficiency Index reveals whether security spending produces measurable EBITDA return ($10–$144 per dollar invested) or diminishing returns.
-
AI-generated independent Risk Profiles for both acquiring and target companies.
-
Quantifies unfunded EBITDA liabilities that affect deal valuation — some M&A deals have lost up to $100M from undetected cyber exposure.
-
Digital twin modeling shows post-acquisition EBITDA impact before the deal closes.
-
Maps risk quantification to NIST, ISO 27001, CMMC, HIPAA, PCI DSS with 650+ remediation playbooks.
-
Data-driven, auditable evidence that replaces checkbox compliance.
-
Supports SEC cyber disclosure requirements.
-
AI-driven actuarial quantification of actual EBITDA exposure to determine appropriate coverage, deductibles, and policy structures.
-
Identifies where self-remediation delivers better EBITDA return than insurance transfer.
-
Prevents underinsurance disasters — UnitedHealthcare held only $100M coverage against $6.3B in actual losses.
-
Automated SBOM generation, proprietary RBOM tracking across dev/ QA/ staging/ production, and CISA KEV scoring.
-
Continuous monitoring of software components with financial impact quantification. (UNIFY)
Measured Cyber Exposure Outcomes. Not Marketing Claims.
Every result below was produced by the Thrivaca AI Engine — the same actuarial AI architecture validated by insurers, the Department of Defense, and leading academic institutions.
These are EBITDA outcomes, not projections.
EBITDA at risk reduced from 18.6% to 4.98% (−73%).
97% of cybersecurity exposure eliminated over 5 years.
~$7M in annual earnings protected.
$145 in EBITDA exposure reduction per $1 invested.
CEO: “This is the first time I’ve felt I can be comfortable.”
$381M in actual EBITDA exposure discovered vs.
$75M estimated (408% variance).
$25M in previously unrecognized costs recovered in Year 1.
EBITDA risk carrying cost reduced 8.2% in first year.
Transformed from opinion-based risk management to AI-driven EBITDA governance.
Replaced a $300K consulting engagement that produced opinion-driven results.
Discovered 89% underestimation of data breach risk and 98% miscalculation of ransomware losses.
Quantified exposure in dollar terms for the first time.
Identified unfunded liabilities and insurance gaps invisible to prior assessments.

97% Risk Eliminated
408% Hidden Exposure Eliminated

$145 ROI Per $1
Within 7% of Actual Loss Outcomes
3,500+ Companies Benchmarked
What Changes for Your Organization.
CISOs & SECURITY TEAMS
One AI-driven unified exposure metric across every tool in your stack — expressed in EBITDA impact, not vendor scores.
AI-optimized remediation roadmaps with 650+ NIST-approved playbooks.
Complete SBOM/RBOM visibility.
Stop managing alerts — start managing EBITDA exposure.
CFOs & FINANCE
Cyber exposure quantified in EBITDA terms — comparable, accountable, and financially defensible.
Current EBITDA at risk, projected EBITDA after controls, and every remediation dollar tracked against EBITDA return.
Leading organizations achieve $10–$144 in EBITDA exposure reduction per $1 invested.
BOARDS & C-SUITE
Two defensible numbers: current EBITDA at risk and projected EBITDA exposure after controls.
AI-generated actuarial governance metrics that replace heat maps with financial precision.
30-minute quarterly board reviews demonstrating measurable EBITDA protection.
LEGAL & COMPLIANCE
Audit-ready, NIST-aligned documentation that withstands regulatory and litigation scrutiny.
Tracks organizational risk progression over time.
Supports both defense and insurance recovery arguments.
INSURANCE & RISK TRANSFER
Quantified exposure modeling to optimize coverage and strengthen premium negotiations.
Identifies where self-remediation is more cost-effective than insurance transfer.
Simulate Cyber Exposure Before You Spend.
- One healthcare organization used the AI-powered digital twin to evaluate seven potential improvement scenarios before committing resources — reducing EBITDA at risk from 18.6% to 4.98%.
- A financial services firm discovered $381M in hidden EBITDA exposure — 408% more than estimated.
- The digital twin turns every strategic decision into a measured EBITDA investment.
AI-Powered EBITDA Intelligence From Your Existing Tools.
The Thrivaca AI Engine integrates with your existing security stack — no replacement required.
AI-driven normalization transforms every tool’s output into EBITDA exposure intelligence.
Your prior security investments become more valuable the moment they connect to the engine.
-1.png "Integration Stack")
How Much EBITDA Exposure Are You Carrying?
Most organizations discover they’re underestimating actual EBITDA exposure by 89–400%.
A 30-minute executive briefing will show you where your hidden exposure is —
and what it’s costing your EBITDA every quarter you don’t measure it.